What products are involved in this article?
This article is based on the use of RCP (Rheonics Control Panel) connected to the SME (Smart Module Electronics) operating SRD, DVP, and DVM. Hence it can be used for any of these Rheonics sensors.
What is the purpose of this article?
Explain the process to get calculated Specific Gravity or Relative Density with the 8-variable regression model.
1. Math modelShown below is the mathematical formula for the specific gravity (8-variable model)

Equation 1. Specific Gravity (Concentration 8-variable model temperature compensation)
The SRD sensor can measure inline density, viscosity, and temperature, in addition, we can use multiple mathematical models to calculate the concentration of a mix. To calculate the specific gravity of a fluid we can use Equation 1, where:
T1: Inline temperature measured in °C
T2: Reference temperature of the water.
SG: Specific gravity
2. Checking the dataAll density, viscosity compensation, and concentration models can be loaded onto the sensor through the RCP software from Rheonics, in the “Calculation” tab.
This Concentration Specific Gravity model provides two options to input data, these are “Load List Dataset” (Figure 1) and “Load Dataset” (Figure 2). The data in both options can be filled out manually in each cell or can be loaded with a .csv file as shown in Table 1.
If you already have a table of temperature-concentration-density data of the fluid you can enter it directly to the RCP. Otherwise, you can get the values by testing the sensor in the fluid by changing the temperature and concentration of the fluid.
Input Data Type | |
List Dataset | Table Dataset |
 Figure 1. List dataset RCP view Figure 1. List dataset RCP view |  Figure 2. Table dataset RCP view Figure 2. Table dataset RCP view |
Table 1. Input data type for the specific gravity (8-variable model)
3. How to load models into the Sensor electronics?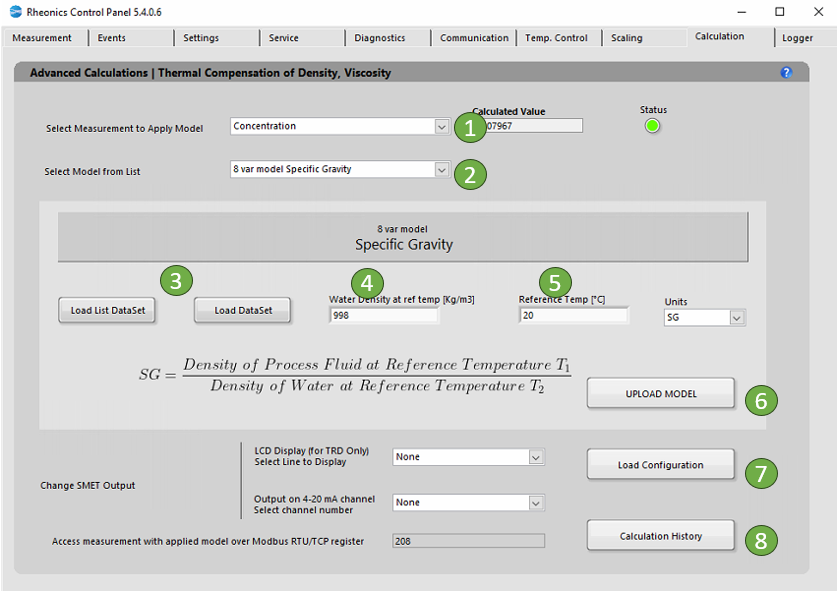
The following steps are to load the models into sensor electronics:
In the “Select Measurement to Apply Model” dropdown list select “Concentration”.
In the “Select Model from the list” dropdown list select “8 var model Specific Gravity“. When you select the model, you will get more information about the specific equation used and the coefficients you will need.
We have to load the data to calculate the model, in this example, we are going to click the “Load Dataset” button and the next table (Figure 4) will be shown. You can also load the data with the “Load List Dataset” button.
 Figure 4. Dataset Table
a. Load data: you can do this manually or with a CSV file.
a1. Manual input: The user has to fill out the data manually, complete the table writing the values in each cell
.
a2. CSV file input: If the user already has the data in a CSV file, click the “Import” button and select your file with the data for the model.
b. Internal calculation: Click the “calc. coeff.” button to calculate the coefficients of the model.
c. Calculated coefficient values by the internal model will be shown in this box.
d. Export data: If you want the current data in the table can be exported in a .csv file with the "Export” button.
e. Load model: Finally, click the “Load & Close” button to load the coefficients in the sensor electronics.
Input “Water density” in Kg/m3 at the reference temperature, in this example, is 998 Kg/m3.
Input “Reference temperature” for the water density, in this example, is 20 °C.
Click “Upload Model” to load the model settings into sensor electronics. The button should turn GREEN for a couple of seconds if the action was successful or turn RED if the operation was unsuccessful. This action will refresh the “Calculated Value”.
 Figure 5. Specific Gravity calculated
Click “Load Configuration” to update the display and channel configurations in sensor electronics.
The “Calculation History” button allows you to open a file with the last uploaded models.
3.1. Handling Sensor Outputs
For the SME-TRD, the compensated viscosity values can be shown on the display. Select the line to display the parameter:
 Figure 4. Selecting read line for LCD display.
Select the analog channel to send data, this can be verified in the “Service” Tab
 Figure 5. Selecting analog output channel
Measurement can always be accessed at the register address that is displayed.

Figure 6. Modbus TCP/IP register
3.2 Demonstration Video
Video 1. Configuration Specific gravity (8-variable model) in RPC Software.