
| What is the purpose of this article? This article explains the setup and configuration to send data from Rheonics sensors through Wi-Fi, and the Node-RED setup in the IPC for remote data visualization through Ignition SCADA. What products are involved? This article is based on using the Rheonics Sensor Module Electronics (SME), an Industrial PC (IPC), and the USR-W610 to send sensor data through Wi-Fi to an MQTT broker and visualize it remotely via Ignition SCADA. |
1. Overview
This article outlines the steps to integrate Rheonics sensors with the USR-W610, an RS232/RS485 to Wi-Fi and Ethernet converter. The integration allows the sensors to connect to a network generated by an IPC. The IPC, connected to the internet via Ethernet, can then forward sensor data to an MQTT broker using Node-RED, which allows for remote data visualization through Ignition SCADA.
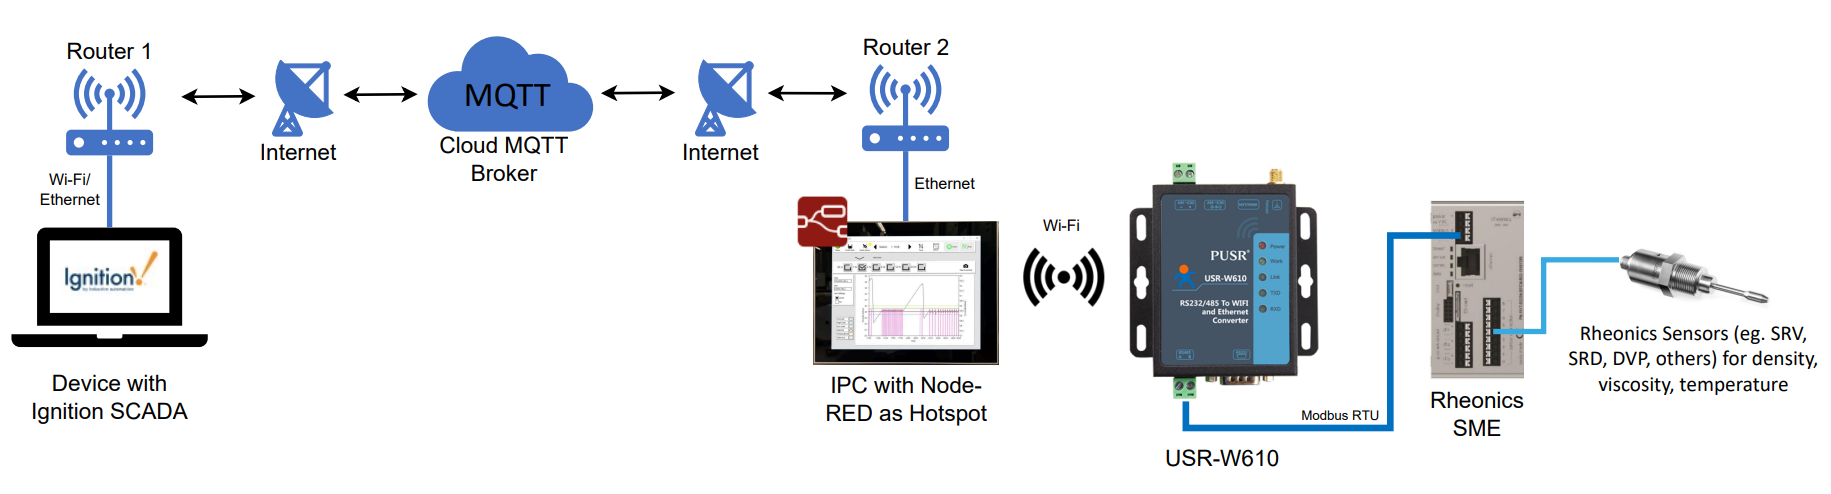
Figure 1. Architecture of Rheonics SME, USR-W610, IPC, and Ignition SCADA integration.
2. Prerequisites
- Rheonics SME with Modbus RTUenabled
- SME connects to the sensor probe and transmits the data using different industrial communication protocols. The Modbus RTU protocol is used in this article.
- Industrial PC (IPC)
- Robust computer used in industrial environments.
- MQTT broker
- A cloud-based MQTT message broker acts as an intermediary between clients that send (publish) and receive (subscribe) data. In this case, it transmits the sensor data received from Node-RED to Ignition for remote visualization.
- Ignition SCADA
- An industrial platform that can connect to an MQTT broker, enabling real-time data visualization and interface creation for monitoring multiple devices.
- USR-W610
- RS232/RS485 to Wi-Fi & Ethernet converter that allows the Rheonics SME to connect to a Wi-Fi network and send data using Modbus RTU.
3. USR-W610 Setup
The USR-W610 module is used to send serial data to a Wi-Fi network. In this case, the device is configured as STA, so it connects to the Wi-Fi network generated by the IPC.
| To configure the USR-W610 as STA and connect to a Wi-Fi network, refer to Connecting Rheonics Sensors to Wi-Fi Networks using USR-W610. |
1. Connect to the network generated by the IPC.
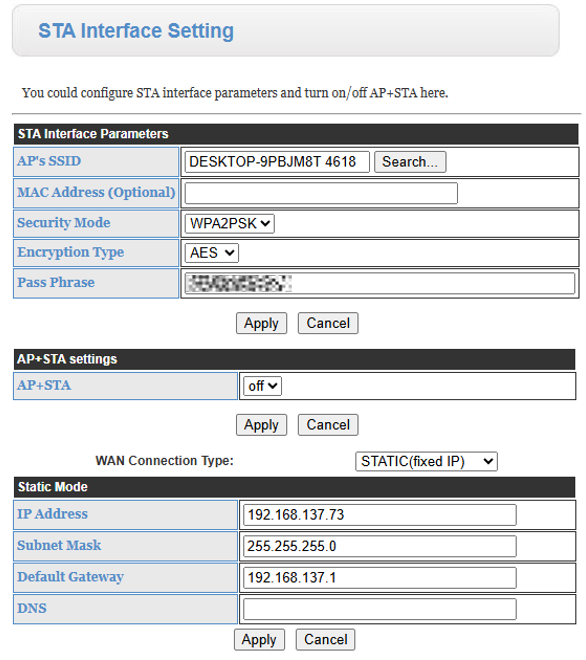
Figure 2. STA network configuration.
2. Once the USR-W610 is connected to the Wi-Fi network, wire it for serial communication as shown in the diagram below.
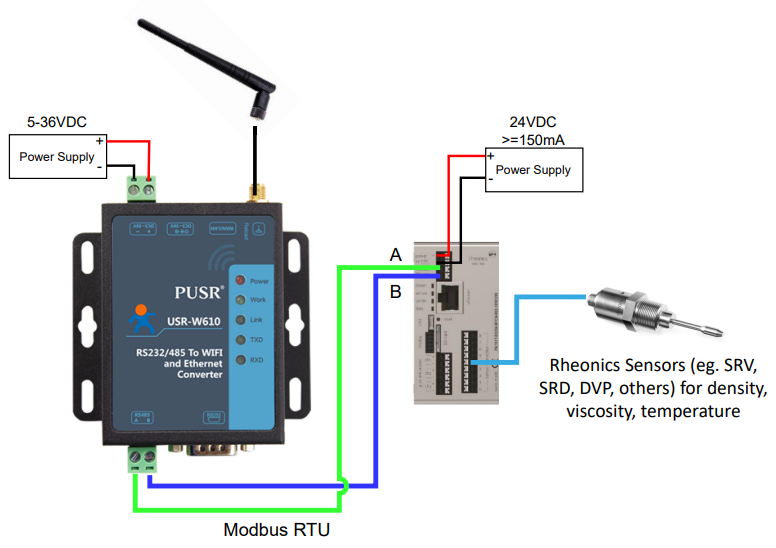
Figure 3. Wiring diagram of USR-W610 to Rheonics SME.
4. IPC Setup
The IPC used in this article runs Windows 10, which is compatible with Node-RED. If using another OS, refer to Node-RED Setup and MQTT for Rheonics Sensors.
4.1. Node-RED installation
Node-RED is used for different applications and can be easily configured to implement data acquisition via Modbus TCP obtained from the USR-W610 and send it to an MQTT broker.
| To learn the basic steps for setting up Node-RED and using the modules mentioned in this article, visit Node-RED Setup and MQTT for Rheonics Sensors. |
4.2. Obtaining Data in Node-RED
The goal is to obtain sensor data via Wi-Fi in Node-RED and send it to an MQTT broker.
1. The USR-W610 sends the data as Modbus TCP, so the node-red-contrib-modbus module in Node-RED is needed.
2. The configuration for the Modbus client is as follows, using the IP address assigned to the USR-W610 during its configuration and the Modbus address of the SME (default: 1).
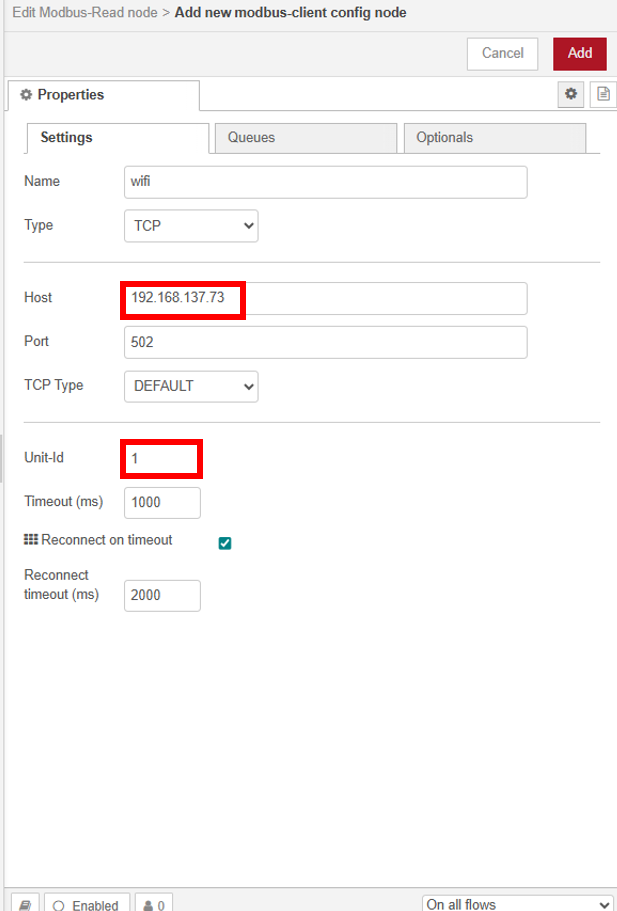
Figure 4. Modbus-client configuration.
3. To send data from a Rheonics sensor to an MQTT broker, refer to Integrating Rheonics Sensors with Node-RED and MQTT for Remote Data Access.
4. The Node-RED flow to read viscosity, density, and temperature and send them to an MQTT broker looks as follows.
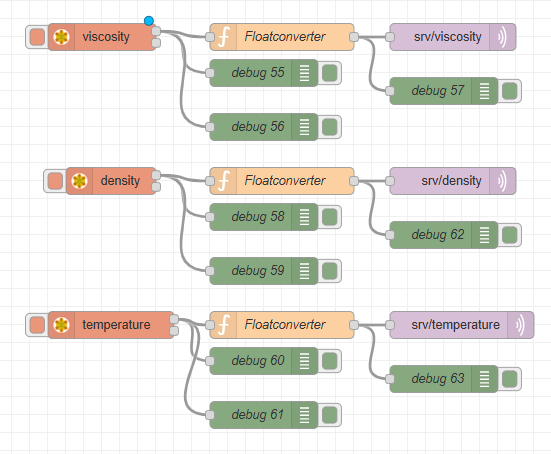
Figure 5. Node-RED flow.
5. Visualization through Ignition
Now that the Rheonics sensor data has been published to the MQTT broker, the parameters can be visualized remotely with Ignition through another device.
| To learn how to connect Ignition SCADA to an MQTT broker to visualize Rheonics sensor data, refer to Using Ignition SCADA to Visualize Rheonics Sensor Data via MQTT. |
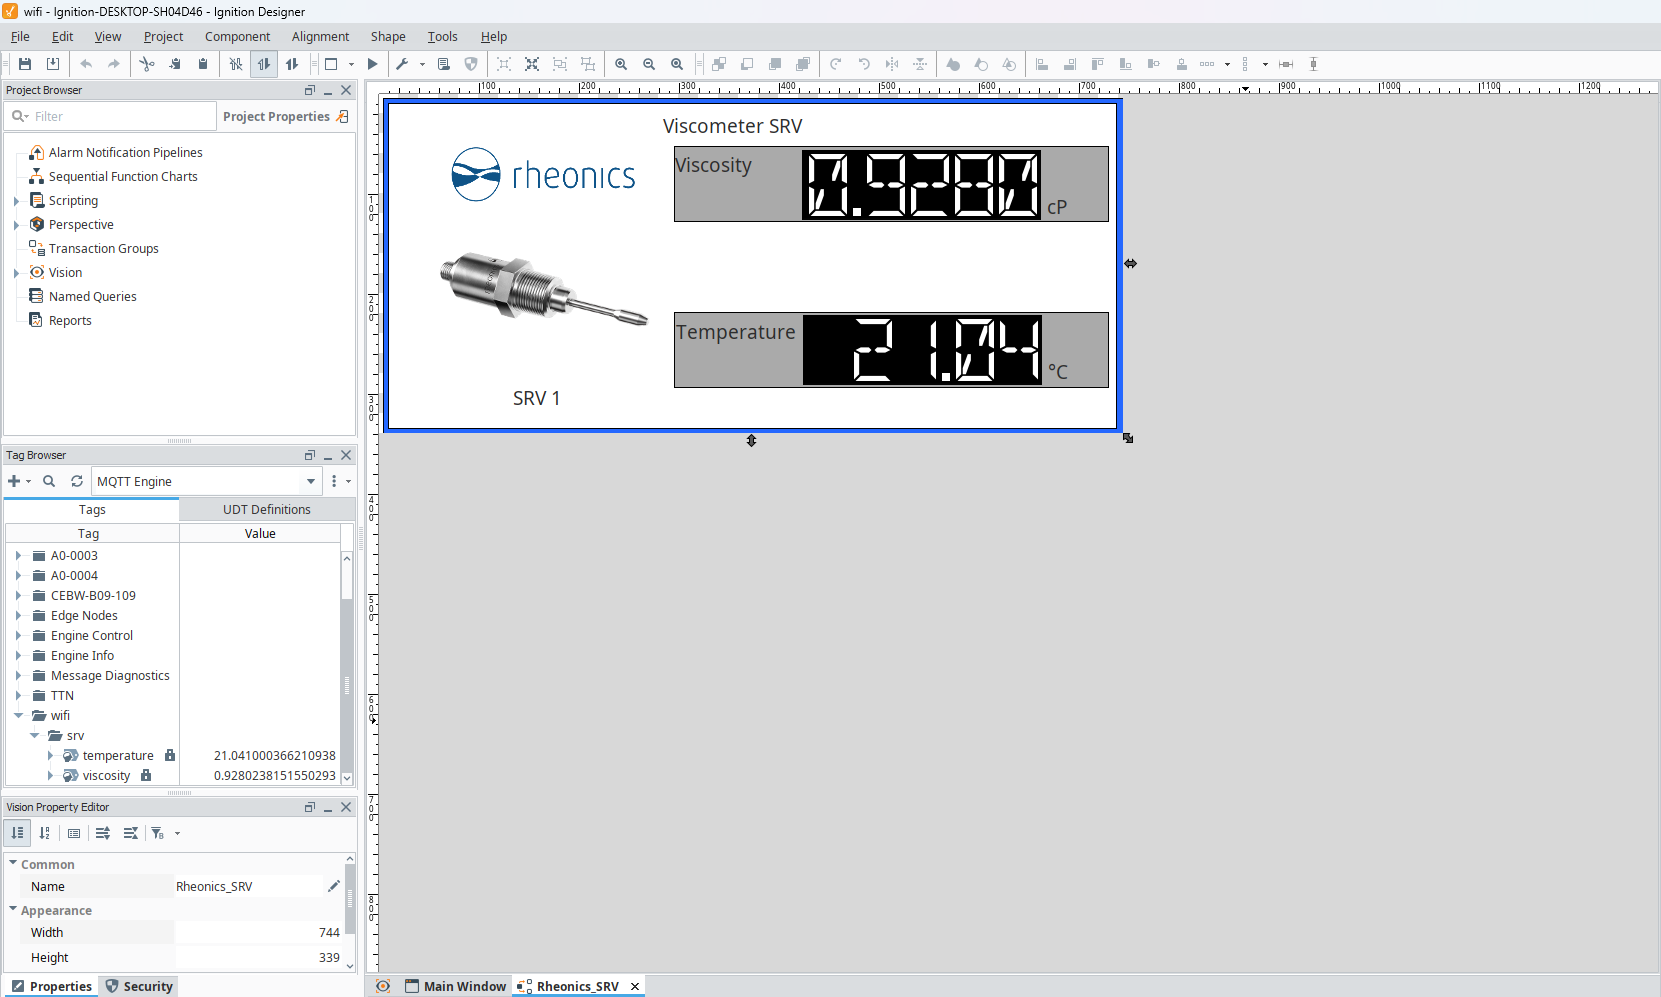
Figure 6. Ignition visualization.